One Algo Trading Platform. Built for Brokers, Fintechs, Advisors & Retail Traders
Whether you're a broking house, fintech platform, hedge fund, RIA, RA, quant team, or sophisticated retail participant — AlgoBulls provides a SEBI-aligned, fully managed algorithmic trading infrastructure. AlgoBulls gives you the tools, infrastructure, and compliance to build, deploy, and scale algorithmic strategies with ease - without servers, delays, or complexity.
- AlgoBulls Overview
- Odyssey Overview
- Phoenix Overview
Who is algobulls for?
Broking Houses & Fintech Platforms
Offer algorithmic trading capabilities to your clients with white-labeled, scalable, compliant infrastructure. Seamless integration, enterprise-grade execution, audit-ready logs, and SLA-backed stability.
Explore Enterprise SolutionsHedge Funds & Asset Managers
Automate portfolio strategies, reduce manual execution risk, and offer enhanced execution algos to clients under your own brand.
Explore Enterprise SolutionsProprietary & Quantitative Trading Desks
Deploy proprietary models securely using our infra. Scale execution with full control, zero infra burden, and real-time analytics.
Explore Institutional OfferingRIAs & RAs
Develop and deploy strategies for your internal use or for your clients with full compliance visibility. Build using no-code, low-code, or full code tools — backed by institutional-grade infrastructure.
Explore Enterprise SolutionsQuant Developers & Technical Teams
Build advanced strategies using Python, ML, CLI, notebooks, or external signal integrations — without needing to manage servers, APIs, or high-availability systems.
Explore Developer ToolsRetail Traders & Investors
Choose ready algorithms or create your own using no-code tools, AI-assisted builders, or full-code environments — all deployed on institutional-grade infra.
Explore Retail SolutionsWhat Sets us apart?
AI, No-Code & Full-Code Strategy Building
Phoenix Suite for everyone to create your custom strategy with maximum flexibility and choice.
SEBI-Aligned, Exchange-Ready Architecture
Use libraries like scikit-learn, TensorFlow to build advanced predictive algos through Python Build.
Enterprise Infrastructure with SLAs
Our strategy onboarding, documentation, and RA partner workflows are designed in line with SEBI’s regulations.
Zero Tech Maintenance
Scalable backend, white-label dashboards, RA management tools, and API support to serve 10 or 10,000 clients.
Advanced Monitoring & Observability
Fully cloud-managed. Just build and deploy. You take care of your strategy while we take care of the entire tech for you.
External Signal Integrations
Execute your strategies by taking signals from TradingView, Chartink, Excel, APIs or your existing setup.
Backtesting, Paper & Live Trading
All mode of executions from one platform without changing a single line of code.
AlgoBuddy Support
AI chatbot trained on user queries and expert insights to help you algo trade effortlessly.
What You Can Use?
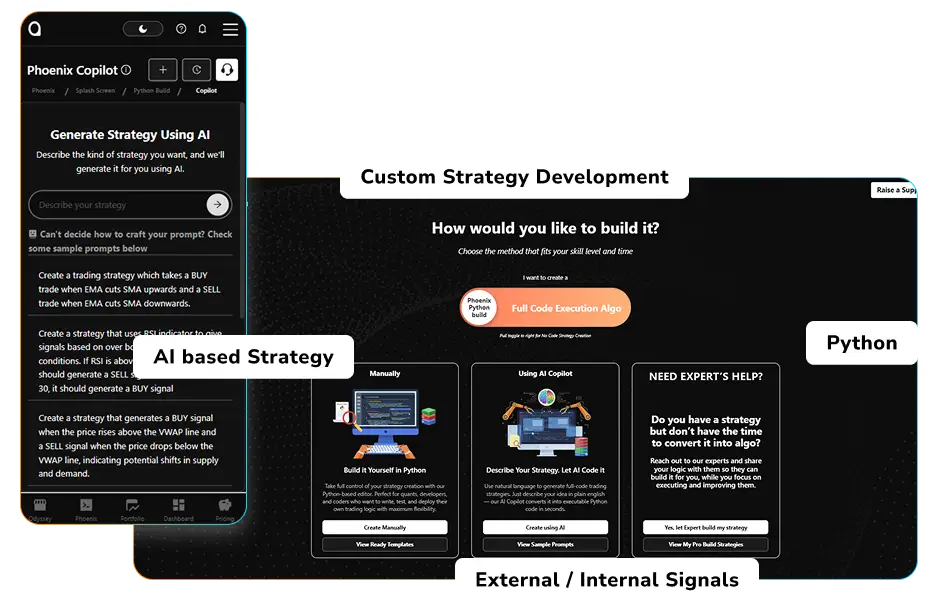
Phoenix – Strategy Building, Your Way
Enterprise teams and individual users can choose between:
- Classic Build (No-Code) – Create equity & options algos via structured logic blocks and multi-leg builders.
- Copilot (AI Builder) – Describe the strategy in natural language; AI creates the no-code or full-code strategy logic.
- Pro Build – Our experts build the strategy using your documented rules.
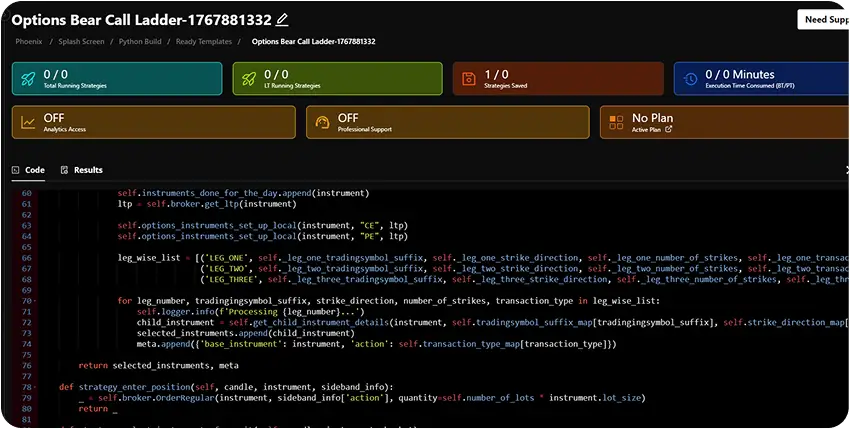
- Python Build – For quants and developers who prefer to have the flexibility of coding their strategies. All workflows support SEBI-aligned strategy onboarding and enterprise execution visibility.
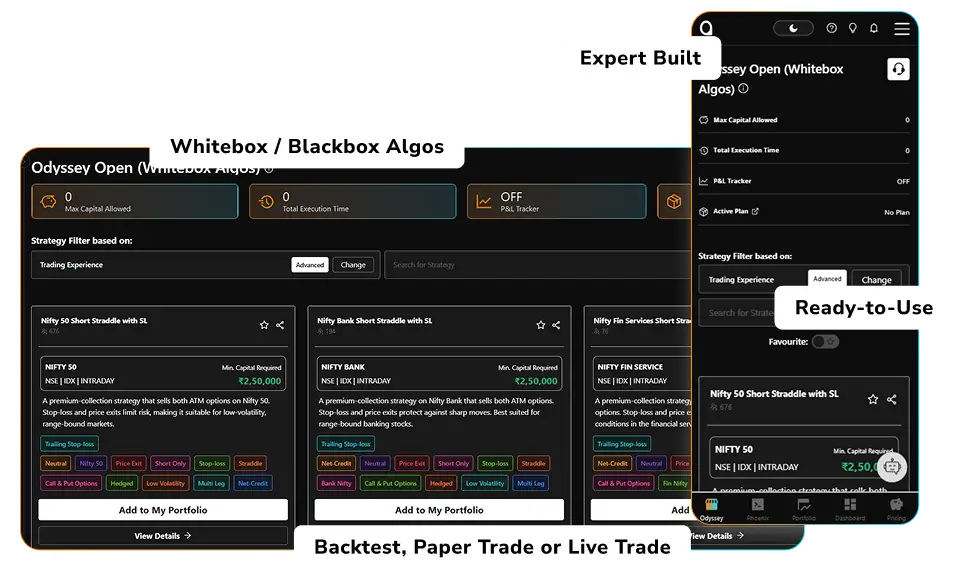
Odyssey – Deploy Execution-Ready Algos Instantly
With Odyssey, you can:
- Choose from transparent, whitebox strategies under Odyssey Open, with blackbox institutional models arriving soon under Odyssey Edge.
- Designed for both retail users and enterprise partners who want ready, compliant, execution-grade algos.
💬 Have a question? Ask AlgoBuddy — Your Smart Algo Assistant
Our AI-powered chat bot can help you with:
- Choosing the right product
- Understanding platform features
- Clarifying strategy-building steps
- Live help—24/7
Exchange Empanelment
Designed for compliance. Operated with institutional discipline.
We are proud to be empanelled with NSE, BSE & MCX, ensuring institutional-grade reliability and seamless compliance with exchange-driven algo requirements.


Global Security Standards
Our infrastructure follows ISO 27001:2022 information security standards, reflecting our commitment to secure, compliant, and resilient algo operations.

Looking to get empanelled yourself as an algo provider?
Features that matter

100% Automated Execution
End-to-end automation across equity & derivatives with audit trails matching regulatory expectations.

AI & ML Strategy Capabilities
Support for institutional quant workflows, ML pipelines, and predictive modeling.

Enterprise-Ready Infra
Redundant architecture, scalable compute, managed APIs, and observability built for brokers and fintech-scale traffic.

Backtesting, Paper & Live Trading
Accurate historical simulation models and risk-aligned deployments.

Zero Infra Maintenance
You host, but we maintain, and monitor everything — freeing your tech team from operational load.

Full Analytics & Trade Logs
Institutional-grade transparency for retail traders and enterprises’ compliance teams and auditors.

Custom Integrations (API / White-Label)
Full support for enterprise embedding, OEM branding, and API-driven extensions.
Want to launch your own algo desk or client execution platform?
We offer a full-stack SEBI-aligned enterprise solution for:

Broking Houses
White-labeled platforms with multi-user management and risk controls.

Fintech Platforms
Embedded algo execution for your existing app or ecosystem.

PMS, Hedge Funds, Prop Firms
Automate research, backtesting, and execution via a unified infra.

Investment Advisors & Research Analysts
Structured onboarding for exchange approvals.
Enterprise-Class Reliability & Regulatory Confidence
For brokers, fintechs, funds, and professional desks, AlgoBulls provides the infrastructure, workflows, and support needed to operate at institutional scale.
Guaranteed SLA & Dedicated Helpdesk
Priority support channels, escalation pathways, and high availability commitments for mission-critical operations.
Enterprise Backoffice / Admin Panel
Manage users, track activity, audit logs, view executions, enforce permissions, and maintain complete operational oversight.
Compliance-Aligned Execution Stack
Built around SEBI and exchange guidelines with transparent logs, risk workflows, and audit-ready data structures.
Risk & Control Framework
Real-time monitoring, fail-safes, version controls, error-resolution workflows, and infrastructure redundancy.
Enterprise Integration & Advisory
Full guidance for platform enablement — from compliance preparation to architecture mapping to launch support.
$1+ Billion
Live Trading Volume
1+ Million
Live Orders
1K+
Direct Clients
1M+
Clients Across Enterprises
1+
Supported Broking Houses
1+
OMS Vendors Supported
TRUST & COMPLIANCE

SEBI-Aligned Workflows
From strategy onboarding to risk controls, logs, and disclaimers — built to satisfy SEBI algo guidelines.

Compliance-Ready Infrastructure
Logs, approvals, traceability, audit trails, and operational oversight systems designed for regulated environments.

Trusted by Industry Leaders
Brokers, RAs, fintechs, and institutional desks rely on AlgoBulls for secure large-scale deployment.
Testimonials
Don’t just take our words for it
“AlgoBulls helped us launch our own algo platform under our brand in under 30 days.”

“Our research team now delivers live algos to clients with zero manual intervention.”

“I built and deployed my first Python strategy without worrying about infra or brokers.”
And, the Media Mentions & Awards


Our Achievements
A Legacy of Trust and Performance
The Best Algo Trading Platform – 100% Regulatory Compliance for Secure & Hassle-Free Trading


"Winner, Emerge 50 Awards"
NASSCOM, 2024

"Best Automated Trading Software"
Runner-up, Benzinga Fintech Awards 2024
"Fintech Startup of the Year"
Finalist, India Fintech Awards 2024
"Best Paper Trading Platform"
Finalist, Benzinga Fintech Awards 2024
"India-US, Emerging Company"
Finalist, TieCon East 2025


