EMA Crossover
This is a trading strategy called "EMA Regular Order Strategy" implemented in Python using the PyAlgoTrading library. The strategy is based on the exponential moving average crossover.
Links
Jupyter Notebooks for Indian Exchange (NSE)
Jupyter Notebook for US Exchange (NASDAQ)
EMA indicator
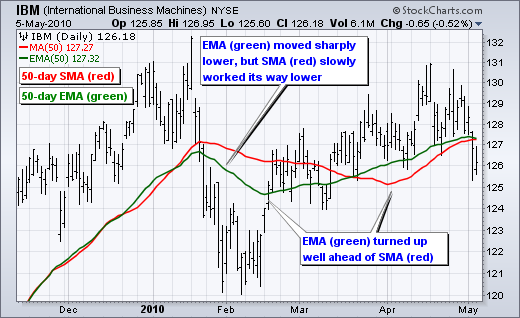
Exponential Moving Averages (EMAs) are a popular technical analysis tool used in the stock market. They are similar to Simple Moving Averages (SMAs), but they place greater emphasis on recent price data.
Here is a summary of Exponential Moving Averages:
- An Exponential Moving Average is a type of moving average that assigns more weight to recent prices, making it more responsive to current market conditions.
- Unlike the SMA, which gives equal weight to all data points, the EMA assigns exponentially decreasing weights to older data points.
- The formula for calculating an EMA involves using a smoothing factor or multiplier that determines the weight given to the previous EMA value and the current price.
- The most common period used for EMAs is 12 and 26 days, representing short-term and long-term trends, respectively.
- EMAs are commonly used to identify trend direction, support and resistance levels, and potential entry or exit points.
- When the price crosses above the EMA, it may signal a bullish trend, while a cross below the EMA may suggest a bearish trend.
- The EMA is more responsive to price changes compared to the SMA, making it useful for short-term trading strategies.
- EMAs are often used in conjunction with other technical indicators, such as the Moving Average Convergence Divergence (MACD), to generate trading signals.
- Traders and investors use Exponential Moving Averages to smooth out price fluctuations, identify trend reversals, and determine potential support and resistance levels. They provide a visual representation of the average price over a specific period, with greater weight given to recent prices.
 |
|---|
| Fig.1 - IBM candle chart (top) with EMA (green) and SMA (red) lines |
Strategy Overview
This strategy, called EMA Regular Order Strategy, implements a crossover strategy using Exponential Moving Averages (EMA). It generates entry and exit signals based on the crossover of two EMAs.
Strategy Parameters
The following parameters can be configured for the strategy:
| Name | Default Value | Expected Value | Description |
|---|---|---|---|
| TIME_PERIOD1 | None | greater than 0 | Period (number of candles) by which EMA-1 is calculated |
| TIME_PERIOD2 | None | greater than 0 | Period (number of candles) by which EMA-2 is calculated |
Crossover Calculation
The get_crossover_value method calculates the crossover value based on the two EMAs of the closing prices. It uses the talib.EMA function from the Talib library to calculate the EMAs. The method then determines the crossover between the two EMAs and returns the corresponding value (-1, 0, or 1).